Home ›
Data Desk › Capricor Therapeutics Inc. reports $44.3M of cash, about 4.4 months at its recent burn
MarginsX Data Desk · Quarterly results · FDA approval · Licensing and milestone payments · At-the-market offering
Capricor Therapeutics Inc. reports $44.3M of cash, about 4.4 months at its recent burn Capricor Therapeutics Inc. (CAPR) filed its 10-Q on Nov 10, 2026, covering the quarter ended Sep 30, 2026. (SEC XBRL company facts, 10-Q, Nov 10, 2026)
By the MarginsX Data Desk, automated. Published November 14, 2026. Data as of November 10, 2026.
Revenue and margins
The net loss was $42.7M. (SEC XBRL company facts, 10-Q, Nov 10, 2026 )
Balance sheet
Cash was $44.3M at Sep 30, 2026, against $20.9M at Jun 30, 2026. (Company health, computed by us from SEC filings and XBRL, Sep 30, 2026 )
Shares outstanding were 58.1 million, against 58.1 million at Jun 30, 2026. (SEC XBRL company facts, 10-Q, Nov 10, 2026 )
At its recent quarterly burn of $30.0M, that cash lasts about 4.4 months, by our estimate from its XBRL cash flows. (Company health, computed by us from SEC filings and XBRL, Sep 30, 2026 )
The stock
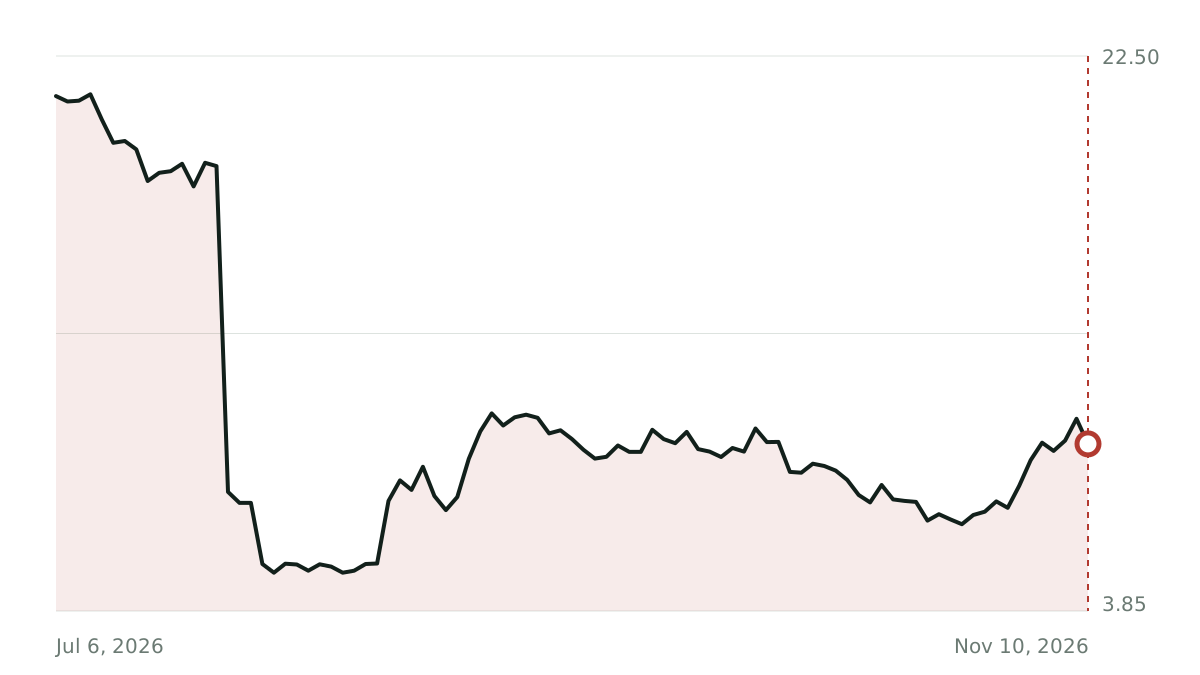
The Nasdaq screener puts its market value at $595.4M. (Nasdaq stock screener, Nov 13, 2026 )
Follow it up
The company's page on MarginsX, with its filings, health check and ownership. (capital.sophiaxt.com/stocks/CAPR )
The filing on SEC EDGAR. (sec.gov )
The filing in the MarginsX reader. (MarginsX reader )
Automated from SEC filings and market data by the MarginsX Data Desk, written by template with no AI. For information only. Not investment advice.
Facts behind this article Fact Value Source As of Name Capricor Therapeutics Inc. Source 2026-11-13 Cash 44,279,993 USD Source 2026-09-30 Runway 4.4 months Source 2026-09-30 Who Capricor Therapeutics Inc. (CAPR) Source 2026-11-13 Symbol CAPR Source 2026-11-13 Form 10-Q Source 2026-11-10 Filed Nov 10, 2026 Source 2026-11-10 Period end Sep 30, 2026 Source 2026-11-10 Net loss 42,656,101 USD Source 2026-11-10 Net income -42,656,101 USD Source 2026-11-10 Cash prior 20,935,187 USD Source 2026-11-10 Prior end Jun 30, 2026 Source 2026-11-10 Shares 58,142,114 shares Source 2026-11-10 Shares prior 58,138,989 shares Source 2026-11-10 Burn abs 29,998,738.25 USD Source 2026-09-30 Burn -29,998,738.25 USD Source 2026-09-30 Cap 595,375,247 USD Source 2026-11-13
Sources
Automated from SEC filings and market data. No AI. For information only. Not investment advice.
Discuss in MarginsX More from the Data Desk
More on MarginsX Companies in this article Topics Related Data Desk stories Every Data Desk article: /desk · RSS